Multi revolutions Lambert Problem
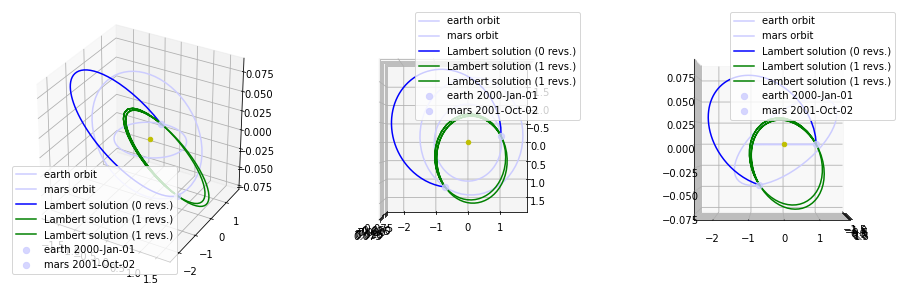
The example demonstrates the basic use of the multiple revolution Lambert solver. In particualar, it defines a fixed geometry of the Earth-Mars constellation and plots all possible resulting solution to the Lambert’s problem. The chosen geometry is such that one revolution solutions exists and are thus visualized.
The Lambert algorithm implemented in pykep is the original from the following paper:
Izzo, Dario. “Revisiting Lambert’s problem.” Celestial Mechanics and Dynamical Astronomy 121, no. 1 (2015): 1-15.
[1]:
# Imports
import pykep as pk
from pykep.orbit_plots import plot_planet, plot_lambert
from pykep import AU, DAY2SEC
import pygmo as pg
import numpy as np

# Plotting imports
import matplotlib as mpl
from mpl_toolkits.mplot3d import Axes3D
import matplotlib.pyplot as plt
[2]:
# We define the Lambert problem
t1 = pk.epoch(0)
t2 = pk.epoch(640)
dt = (t2.mjd2000 - t1.mjd2000) * DAY2SEC

earth = pk.planet.jpl_lp('earth')
rE, vE = earth.eph(t1)

mars = pk.planet.jpl_lp('mars')
rM, vM = mars.eph(t2)

# We solve the Lambert problem
l = pk.lambert_problem(r1 = rE, r2 = rM, tof = dt, mu = pk.MU_SUN, max_revs=2)
[3]:
# We plot
mpl.rcParams['legend.fontsize'] = 10

# Create the figure and axis
fig = plt.figure(figsize = (16,5))
ax1 = fig.add_subplot(1, 3, 1, projection='3d')
ax1.scatter([0], [0], [0], color=['y'])

ax2 = fig.add_subplot(1, 3, 2, projection='3d')
ax2.scatter([0], [0], [0], color=['y'])
ax2.view_init(90, 0)

ax3 = fig.add_subplot(1, 3, 3, projection='3d')
ax3.scatter([0], [0], [0], color=['y'])
ax3.view_init(0,0)

for ax in [ax1, ax2, ax3]:
    # Plot the planet orbits
    plot_planet(earth, t0=t1, color=(0.8, 0.8, 1), legend=True, units=AU, axes=ax)
    plot_planet(mars, t0=t2, color=(0.8, 0.8, 1), legend=True, units=AU, axes=ax)
    # Plot the Lambert solutions
    axis = plot_lambert(l, color='b', legend=True, units=AU, axes=ax)
    axis = plot_lambert(l, sol=1, color='g', legend=True, units=AU, axes=ax)
    axis = plot_lambert(l, sol=2, color='g', legend=True, units=AU, axes=ax)