Monitoring the Information Flow in a large archipelago
NOTE: For this example you need at least networkx 1.8! If you are still using networkx 1.7, the maximum amount of islands you can draw in the spring layout is limited by 499 due to some bug in that library.
The effect of the generalized migration operator on the optimization process is complex. Here we show how to use PyGMO to visualize and study it on a fairly large archipelago.
from PyGMO import *
prob = problem.rosenbrock(dim = 10)
algo = algorithm.de(gen = 1)
archi = archipelago(algo,prob,1024,20,topology=topology.barabasi_albert(3,3))
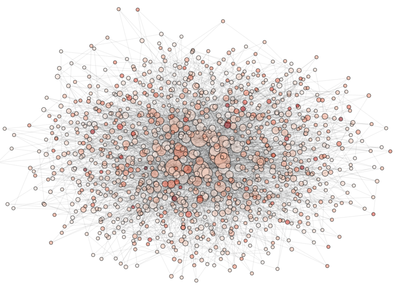
pos = archi.draw(scale_by_degree=True,n_size=1,e_alpha=0.03)
savefig('archi000', dpi = 72)
In the above code we instantiate the archipelago and visualize it, color coding the nodes with the champion’s fitness in the archipelago. We then save the figure in the current directory. The figure will look something like ...
We then evolve 200 times producing, at each step, the picture of the archipealgo with the new evolved fitness
for i in range(1,200):
     archi.evolve(1);
     archi.join();
     pos = archi.draw(scale_by_degree=True,n_size=3,e_alpha=0.03)
     savefig('archi%03d' % i, dpi = 72);
     close()
Putting together the frames produced (in a linux system one can use imagemagik and the simple command
convert archi* movie.gif
we obtain the animated gif ...
NOTE: see how, in the particular archipealgo considered, the optimization proceeds in a centripetal fashion, that is from the ‘suburbs’ to the center. This allows us to learn that highly connected nodes (the hubs) are always behind in the optimization process as, probably, they receive too much information. This is a characteristic of the Barabasi Albert topology. Other topologies have different dynamics. If, for example, we were to use an ageing_clusterd_ba topology the movie below would be produced ...
Showing an entirely different dynamics of the optimization.
The final script (included in PyGMO) is:
def example_2(algo=algorithm.de(1), prob = problem.rosenbrock(10), topo = topology.barabasi_albert(3,3), n_evolve = 100, n_isl = 1024, pop_size = 20, color_code='rank'):
     from PyGMO import problem, algorithm, island, archipelago
     from matplotlib.pyplot import savefig, close
     archi = archipelago(algo,prob,n_isl,pop_size,topology=topo)
     print "Drawing Initial Condition .. "
     pos = archi.draw(scale_by_degree=True,n_size=3,e_alpha=0.03, n_color = color_code)
     savefig('archi000', dpi = 72)
     close()
     for i in range(1,n_evolve):
             archi.evolve(1);
             archi.join();
             print "Drawing"+ str(i) +  "-th evolution .. "
             pos = archi.draw(layout = pos, scale_by_degree=True,n_size=3,e_alpha=0.03, n_color = color_code)
             savefig('archi%03d' % i, dpi = 72);
             close()